ETOOBUSY 🚀 minimal blogging for the impatient
Today I Learned: Portable Grayscale Map
TL;DR
netpbm can come handy.
Today I needed to have some visualization of how some data were
arranged, so I remembered that there’s a very simple format that
allows printing out images quite easily: something to do with pnm.
(This is the sort of information that tends to fill the recesses of my mind until the glorious day of their usefulness comes out. Sort of when you buy that fascinating set of wrenches, which will come out useful some 15 years later after about moving them around for 5 relocations, the last one being just on top of a hardware store).
It turns out that the one format that made my day was PGM, i.e. the Portable Grayscale Map. It represents - unsurprisingly - a grayscale image, with a dynamic range that is set in the file itself by a parameter.
This is a working example of a grayscale image:
P2
16 16
255
163 163 163 163 163 208 208 208 124 124 124 124 124  66  66  66
255 163 163 163 163 163 208 208 208 124 124 124 124 124  66  66
255 255 163 163 163 163 163 208 208 208 124 124 124 124 124  66
255 255 255 255 163 163 163 163 208 208 208 124 124 124 124  66
106 255 255 255 255 163 163 163 163 208 208 208 124 124 124 124
106 106 255 255 255 255 163 163 163 163 208 208 124 124 124 124
106 106 106 255 255 255 163 163 163 163 163 208 208 124 124 124
106 106 106 106 106 255 255 163 163 163 163 208 208 208 124 124
 58 106 106 106 106 106 255 255 163 163 163 208 208 208 208 124
 58  58 106 106 106 106 106 255 255 163 163 163 208 208 208 124
 58  58 106 106 106 106 106 106 255 255 163 163 163 208 208 208
 58  58  58  58 106 106 106 106 106 255 255 163 163 163 208 208
  0  58  58  58  58  58 106 106 106 106 255 163 163 163 163 208
  0   0   0  58  58  58  58 106 106 106 106 255 163 163 163 163
  0   0   0   0   0  58  58  58 106 106 106 106 255 163 163 163
  0   0   0   0   0   0  58  58  58 106 106 106 106 163 163 163
So… it’s just printing out values after a minimal header:
- the
P2string - the width and the height, in this order
- the maximum value, corresponding to white (greater than
0and less than65536) - the data, starting from top-left and ending on bottom-right
That’s it. It’s possible to use whatever whitespace separator between all items, the arrangement above is only cosmetic and every sample might be on its own line, or be arranged differently (with some limitations).
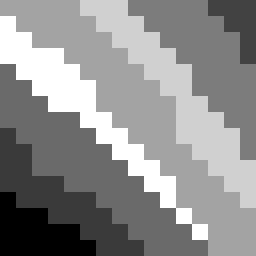
This is the resulting image, in PNG format (16x magnification):
Actually I generated the image with an editor, then used Gimp to convert it to a PGM format. To re-arrange its output in the way shown in the textual example above, I used the following Perl program:
#!/usr/bin/env perl
use v5.24;
use warnings;

my $text;
while (<>) {
   s{\# .*}{}gmxs;
   s{\s+\z}{}mxs;
   $text .= ' ' . $_;
}
substr $text, 0, 1, '';

my ($format, $width, $height, $max, @items) = split m{\s+}mxs, $text;

say $format;
say $width, ' ', $height;
say $max;
say join ' ', splice @items, 0, $width for 1 .. $height;

die 'residual stuff!' if @items;
Well, now you know, myself of the future: if you want to quickly visualize some data in a kind of heatmap, PGM is worth considering!
Have fun everyone, and stay safe please!